Vue.jsとSVGでグラフをかいてみる
2019.05.14
こんにちは、千田です。
GWはみなさん楽しめましたか?
千田は帰省したり、もうすぐ4歳になる娘の最初の反抗期が来てしまってそれと戦ってたり、
1歳の息子に携帯を水没させられたり(なんでそうなったかは察して下さい。。。)
とバタバタやってたら、あっという間に終わった感じでした。
さて、今回ですがSVGを使ってWebブラウザ上でグラフをかいてみようと思います。
javascriptを使ってグラフをかく場合、D3.jsやChart.jsなどライブラリは色々とありますが、
フレームワークとの相性が悪かったり、そこまで機能が豊富じゃなくていいんだよなーって時におすすめです。
今回やること
- 棒グラフをかく
- 散布図(分布図)をかく
- 折れ線グラフをかく
- Vue.jsと組み合わせて棒グラフをかく
グラフをかいてみる前にSVGとは?といった点についても軽く触れておきたいと思います。
SVGとは?
Scalable Vector Graphicsの略です。以下、Wikipediaより。
XMLベースの、2次元ベクターイメージ用の画像形式の1つである。ベクタ形式であるため、拡縮自在である。その他に、XMLベースの為、ウェブブラウザで(画像として、という意味ではなく、HTMLのソースビュー等と同様に、という意味で)閲覧でき、テキストエディタ等で編集できる。また、HTMLとの親和性により、ハイパーリンクを埋め込んだり、JavaScript 等と連携させることもできる。
要するにテキストエディタで画像や図がかけて、且つそれは拡大縮小が自在な画像形式だよってことですね。
では、早速かいていきます。最初は棒グラフから。
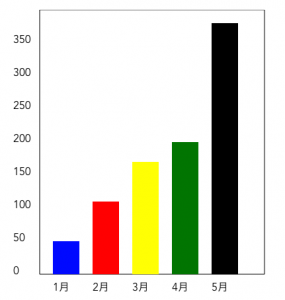
棒グラフをかく
viewboxの指定
まず、最初にviewboxのサイズを指定します。viewboxの詳しい説明はこちらのサイトに記載がありました。
[cc_html]
周りの罫線の指定
サイズが決まったら、とりあえずグラフの表示範囲を線で囲みます。
線を引く時は<line>タグを使用します。
[cc_html]
目盛り表示
グラフなので、目盛りが必要ですね。
テキストを表示する時は<text>タグを使用します。
縦の目盛り
[cc_html]
横の目盛り
[cc_html]
データの表示
枠ができたら表示するデータを記述します。
棒グラフは四角形(長方形)の表示になるので<rect>タグを使用します。
[cc_html]
棒グラフの全体のコードはこんな感じです。
[cc_html]
[/cc_html]
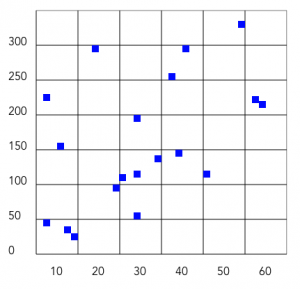
散布図(分布図)をかく
では、次は散布図(分布図)を書いてみようと思います。
棒グラフでなんとなくの感覚は掴んでいただいたと思うので、ここからはちょっと手短に。
罫線や目盛り
[cc_html]
[/cc_html]
データの表示
棒グラフと同様に四角形をかきます。正方形の場合はwidthとheightに同じ値を指定します。
[cc_html]
[/cc_html]
散布図の全体のコードはこんな感じです。
[cc_html]
[/cc_html]
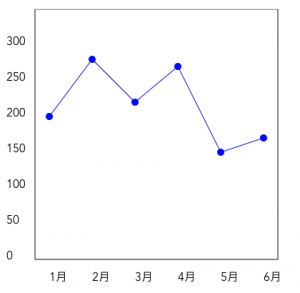
折れ線グラフをかく
では、最後に折れ線グラフを書いてみようと思います。
折れ線グラフは散布図とちょっと似ています。
罫線や目盛り
[cc_html]
[/cc_html]
データの表示
折れ線グラフでは円(点)をかいて、そこで使った座標を使ってそれを線で繋ぎます。
円を書く時は<circle>タグを使用します。
[cc_html]
[/cc_html]
折れ線グラフの全体のコードはこんな感じです。
[cc_html]
[/cc_html]
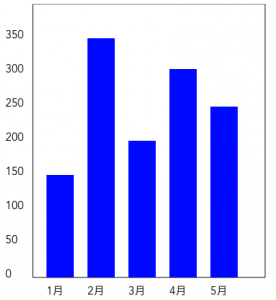
【応用編】Vue.jsと組み合わせて棒グラフをかく
ここまでsvgタグを使ってグラフをかいてきましたが、応用編として実際にjavascriptと組み合わせてかいてみようと思います。
今回はVue.jsと組み合わせてかいてみます。(最近Vue.jsに触れることが多いので)
目盛りなどは先ほどかいたものをそのまま使います。
データの定義
[cc_javascript]
export default {
name: ‘home’,
data () {
return {
dataSet: [
{ month: 1, val: 150 },
{ month: 2, val: 350 },
{ month: 3, val: 200 },
{ month: 4, val: 305 },
{ month: 5, val: 250 }
]
}
}
}
[/cc_javascript]
データの表示
v-for文を使って、データを表示しています。
xで60を掛け算したり、yで引き算をしているのは、描画位置の調整の為です。
[cc_html]
[/cc_html]
まとめ
今回はライブラリを使わずにSVGタグだけで棒グラフ、散布図(分布図)、折れ線グラフをかいてみました。
ライブラリを使わなくても意外と簡単にグラフがかけることが伝わったかと思います。
千田も実際の案件でVue.jsとSVGを組み合わせて使ってみましたが、上記のように基本的なところををおさえておけばサクッとグラフをかくことができました。
それでは!
参考
↓↓↓ぜひチェックしてください
~提供中のヒューマンセンシング技術~
◆なりすまし判定技術
eKYC・顔認証のなりすまし対策を!
https://bio-check.pas-ta.io
◆まばたき検出技術
PCやスマホアプリに組み込めて高精度にまばたきを検出
https://blink.pas-ta.io
◆視距離推定技術
単一RGBカメラで、目からカメラまでの距離を推定
https://vd.pas-ta.io
◆虹彩認証技術
目の虹彩を利用した生体認証技術
https://iris.pas-ta.io
◆視線検出技術
アイトラッキングや次世代UIに
https://eyetrack.pas-ta.io
◆目検出技術
あらゆる目周りデータを高精度に取得
https://pupil.pas-ta.io