【ReactNative】+【Expo】+【react-native-chart-kit】で折れ線グラフを書く
2020.02.12

こんにちは、先日とうとう35歳を迎えたせんだです。
まぁ30歳を過ぎたあたりというか、長女が誕生してからは自分の年齢は正直どうでもよくなってきていているので、あっと言う間に40、50と歳を重ねるのだろうなーと思う今日この頃でございます。
また、35歳を迎えると同時にスワローに入社して1年が経ちました。主に日々の業務の中で触れた開発言語やフレームワーク、ライブラリに関する事をつらつら書かせていただいているせんだブログも2年目に突入致しますので、引き続きお付き合いの程よろしくお願い致します。
さて今回ですが、ReactNativeとreact-native-chart-kitを使って折れ線グラフを書いみようと思います。
それでは、早速やってみましょう。
目次
- react-native-chart-kitのインストール
- 折れ線グラフを書く
- 折れ線グラフにtooltip(ツールチップ)を追加する
環境
端末:Mac Book Pro
OS:macOS Mojave
ReactNativeバージョン:0.61.4
Expoバージョン:3.8.0
Node.jsバージョン:12.13.1
react-native-chart-kitのバージョン:4.4.1
react-native-chart-kitのインストール
react-native-chart-kitを使用するには、react-native-svgも必要になるので、一緒にインストールしましょう。
[cc_bash]
$ expo install react-native-chart-kit react-native-svg
[/cc_bash]
折れ線グラフを書く
react-native-chart-kitのインストールをしたら早速書いてみましょう。
ディレクトリ構成はこんな感じです。
[cc_bash]
├── App.js
├── app.json
├── assets
├── node_modules
├── babel.config.js
├── package-lock.json
└── package.json
[/cc_bash]
まずは、折れ線グラフだけを書いてみます。
App.js
[cc_javascript]
import React, { Component } from ‘react’;
import { StyleSheet, View, Dimensions, Text } from ‘react-native’;
import { LineChart } from ‘react-native-chart-kit’;
export default class App extends Component {
// ラベルの設定
labels = [‘1月’, ‘2月’, ‘3月’, ‘4月’, ‘5月’];
// グラフの色や罫線等の設定
chartConfig = {
backgroundColor: ‘#fff’,
backgroundGradientFrom: ‘#fff’,
backgroundGradientTo: ‘#fff’,
decimalPlaces: 0,
strokeWidth: 0.5,
fillShadowGradient: ‘#fff’,
color: () => `rgba(89, 87, 87, 1)`,
};
// グラフにする値
datasets = [101, 163, 187, 203, 235];
constructor(props) {
super(props);
}
render() {
return (
strokeWidth: 2
}],
}}
width={Dimensions.get(“window”).width – 50}
height={181}
yAxisSuffix={”}
chartConfig={this.chartConfig}
withInnerLines={false}
style={styles.chart}
/>
);
}
}
const styles = StyleSheet.create({
container: {
flex: 1,
justifyContent: ‘center’,
alignItems: ‘center’
},
chart: {
marginLeft: -15,
paddingLeft: 5
}
});
[/cc_javascript]
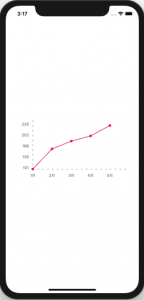
ビルド後、シュミレータで下記のようなグラフが表示されていればOKです。
折れ線グラフにtooltip(ツールチップ)を追加する
折れ線グラフを書いたところで、次は各ポイントをタップした時にツールチップを表示してみたいと思います。せんだはjavascriptでグラフを実装する時にchart.jsを使う事が多かったので、ツールチップは標準機能として使っていたのですが、react-native-chart-kitでは残念ながら標準機能では搭載されていません。
しかし、ツールチップを表示する為の値の取得方法なんかは準備されているので、それを使えば割と簡単に実装可能です。
App.js
[cc_javascript]
export default class App extends Component {
// …省略
constructor(props) {
super(props);
this.state = {
toolTipVisible: false,
point: {
x: 0,
y: 0,
value: 0
}
};
render() {
return (
// 表示中のポイントをタップした時はツールチップを非表示にする
if (this.state.toolTipVisible && data.x === this.state.point.x && data.y === this.state.point.y) {
this.setState({toolTipVisible: false});
return;
}
// ツールチップを表示する座標をstateにセットする
this.setState({point:{
x: data.x,
y: data.y,
value: data.value,
}})
this.setState({toolTipVisible: true});
}}
decorator={(data) => {
return (
)
}}
style={styles.chart}
/>
);
}
}
const Tooltip = (props) => {
if (props.visible) {
return (
{props.point.value}
);
} else {
return null;
}
}
const styles = StyleSheet.create({
/**********
…省略
**********/
toolTip: {
marginVertical: ‘auto’,
marginHorizontal: ‘auto’,
backgroundColor: ‘rgba(35, 24, 21, 1)’,
padding: 5,
width: 50,
height: 25
},
toolTipText: {
color: ‘rgba(255, 255, 255, 1)’,
fontSize: 11,
textAlign: ‘center’
},
});
[/cc_javascript]
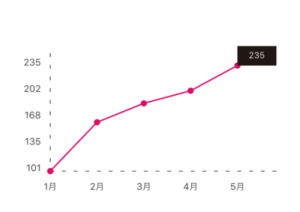
各ポイントをタップした際に下記の様にツールチップが表示されていればOKです。
まとめ
いかがでしたか?
今回はReactNative用のグラフ描画ライブラリとしてreact-native-chart-kitを使ってみました。実際の開発だとwebviewコンポーネントを使えば、D3.jsやChart.jsも動作するので、何を採用するかはケースバイケースかなと思います。(せんだも実際何を使うか悩みまして、react–native-pure-chartも使ってみました)
これからReactNativeをやってみようかなという方々の参考になれば幸いです。
それでは、また!
↓↓↓ぜひチェックしてください
~提供中のヒューマンセンシング技術~
◆なりすまし判定技術
eKYC・顔認証のなりすまし対策を!
https://bio-check.pas-ta.io
◆まばたき検出技術
PCやスマホアプリに組み込めて高精度にまばたきを検出
https://blink.pas-ta.io
◆視距離推定技術
単一RGBカメラで、目からカメラまでの距離を推定
https://vd.pas-ta.io
◆虹彩認証技術
目の虹彩を利用した生体認証技術
https://iris.pas-ta.io
◆視線検出技術
アイトラッキングや次世代UIに
https://eyetrack.pas-ta.io
◆目検出技術
あらゆる目周りデータを高精度に取得
https://pupil.pas-ta.io